Category: Economics

  • The cost of the largest traffic jam in the world

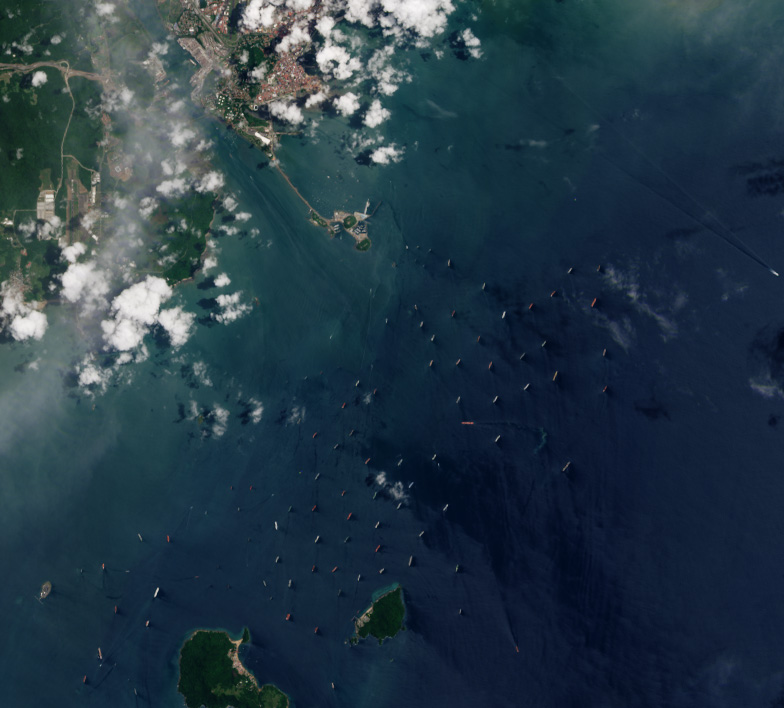
    When you hear of the largest traffic jam, you must be imagining cars, buses, and trucks waiting on a road for hours or days. But what if the largest traffic jam in the world is not on the road? Yes, you heard it right. It is in the sea. More than 200 ships are waiting at the Panama Canal to cross with an average waiting time of 21 days!

    ships waiting to cross panama canal in the pacific ocean
    Satellite image captured by NASA showing ships waiting in the Pacific to cross the Panama Canal

    How does the Panama Canal work?

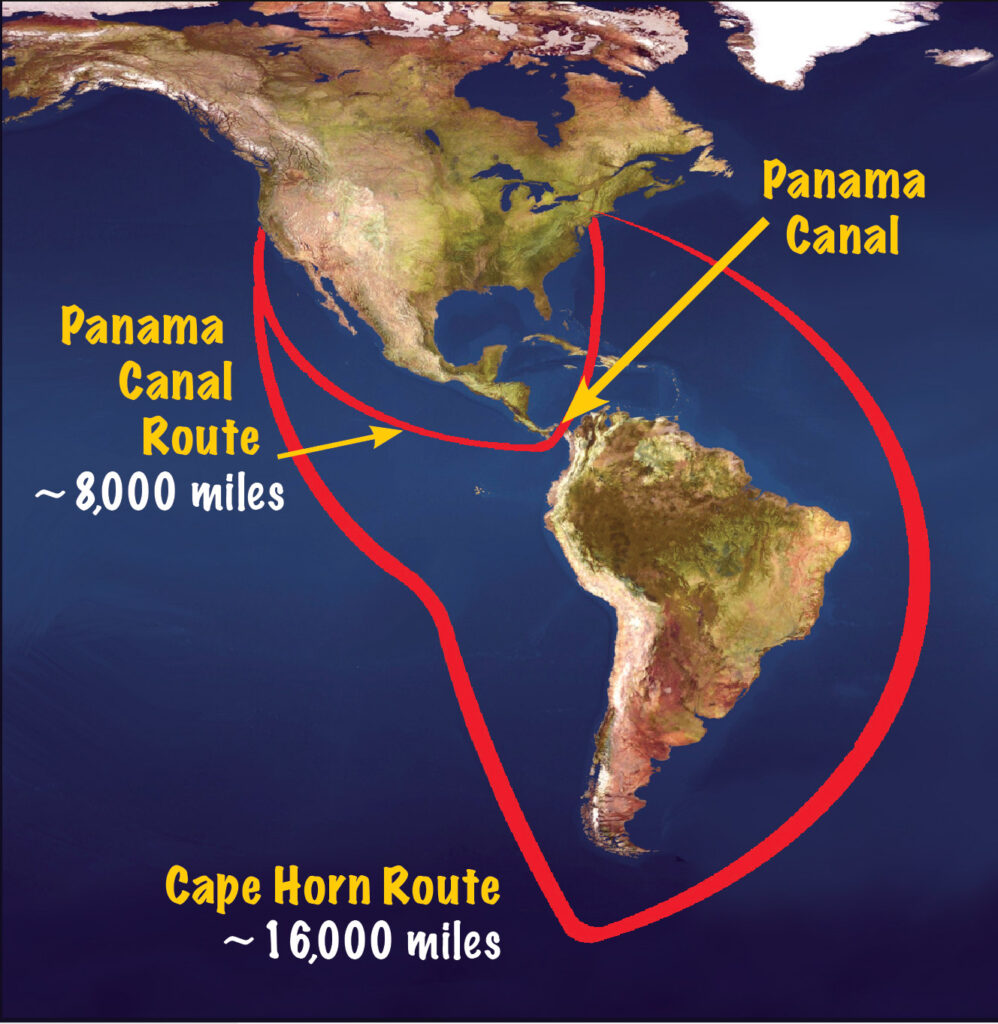
    Panama Canal was built to cut short the distance from the Atlantic to the Pacific oceans and hence save the time and costs for the ships. With this nearly 80km canal, ships skip the encircling around the whole southern American continent. To give a context, a ship from New York to San Francisco sails 8370 km through the canal as opposed to the 20,900km route around the Cape Horn traveling around South America.

    importance of the panama canal
    Panama Canal cut short the distance between the USA’s east and west coasts by skipping encircling the Southern American continent

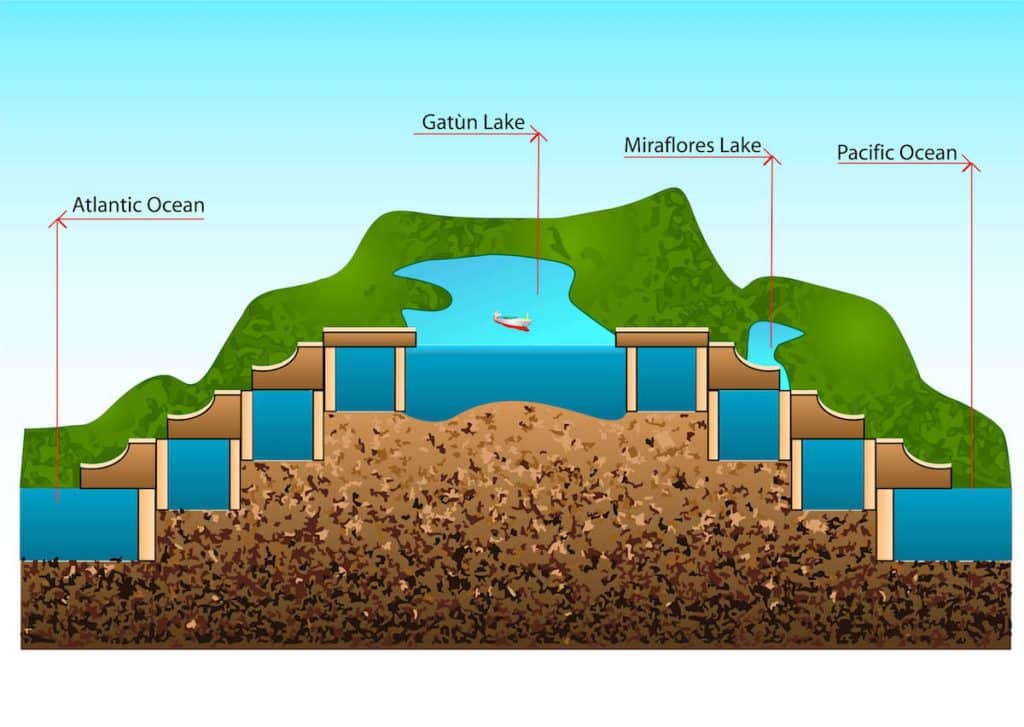
    The canal works on multiple locking and unlockings. As the Pacific Ocean is at a higher altitude than the Atlantic Ocean, a ship entering from the Atlantic has to go up the sea level to finally reach the Pacific. The canal is watered by the freshwater Gatun Lake.

    The way it works is when a ship enters the canal from the Atlantic one of the three locks is filled with freshwater to raise its height. This is repeated two more times until the ship reaches the altitude of Gutan Lake. It then travels through the Gutan Lake until the altitude is finally lowered with the help of locks and it reaches the Pacific. One ship crossing uses around 190 million liters of fresh water from Gutan Lake and it is released into the ocean.

    anama canal working with the locking and unlocking mechanisms
    The working of the Panama Canal

    Why is the huge traffic?

    Because of drought. The source of water for successfully passing a ship to either side is from the Gutan Lake. But the Central American region is facing one of the worst draughts in recent years. Like the other parts of the region, the source of freshwater is from the rains. The Gutan lake gets the water from the Chagres River and its smaller affluents, on which it is dammed, which depend on the rains.

    With fewer rains, the water level of the Lake is decreasing. As it’s the only source of water and give the water level decreasing, the number of daily ship crossings has hence been reduced than normal. As of mid-September, 32 ships are allowed to pass each day which is less than the normal of 36 ships per day. This has led to the change of container ship equations and led to the traffic.

    What is the cost of this?

    Shippers pay a hefty amount to pass through the Panama Canal. During normal times, the fees that have to be paid to cross the canal are anywhere between $150,000 to more than $1 million. This is dependent on the size of the ship.

    Many shippers book the canal for transit well in advance. The canal has now limited the advance bookings and some shippers have opted to pay extra amounts to skip the line of waiting. A shipper paid $2.4 million on top of its transit fee to skip the line!

    The economic impact would be most felt by the United States, as 73% of the total traffic is from or towards the United States. This accounts for $270 Bn in value. Imagine $270Bn worth of goods delayed to the market! This would possibly result in a rise in prices. The shipping companies are in a huge loss because of the loss of time and money.

  • Microeconomics vs macroeconomics

    What is the difference between microeconomics and macroeconomics? How are they related?

    Microeconomics

    When will my car be delivered? When would the new model of my phone be available? What price should I keep for my product? What is my profit margin? How much is the demand for this TV model? 

    These are some normal questions asked by us as individuals or in our profession on a day-to-day basis. These are the questions that directly affect us as individual customers, producers, or suppliers.

    Microeconomics deals with how the supply and demand for goods and services affect the stakeholders of an individual market. It studies how individuals and businesses respond to the economic environment under specific constraints.

    Macroeconomics

    How much is the inflation of a nation? What would be the GDP for next year? How much would a nation grow for the next 10 years? What are the current interest rates?

    Now these are a set of some very trendy and newsworthy questions that we normally hear on channels or newspapers. These questions might not directly affect us as individual customers, producers, or suppliers.

    Macroeconomics deals with a broader and high-level impact on an economy, typically a nation, of policies, and politics. It is concerned with how a nation would respond to a given economic environment.

    The relation of microeconomics and macroeconomics

    Both fields complement each other as they study different parts of a larger picture. Microeconomics focuses on the verticals of an economy – individuals and businesses. Macroeconomics focuses on a larger horizontal – a nation.

    Macroeconomy is the net result of individual microeconomies. Individual microeconomics contribute to a greater effect on the national or international level. The same macroeconomic conditions affect different microeconomies in different ways. For eg; the net export of a nation depends on the demand and supply of the products delivered by individual companies. Here the net export is a macroeconomic factor of study, whereas the demand for a particular product and the supplying company is a microeconomic factor of study.

    To summarize, macroeconomy defines where a nation is heading which is dependent on the net effect of all the microeconomies.

  • India GDP 2023 for Q2

    We look at the economic growth rate of India i.e. the growth of India’s GDP 2023 which was released by the National Statistical Office of the Ministry of Statistics and Programme Implementation of the Government of India

    Economic growth rate of India

    GDP growth Q2 2023: 7.8%
    Period: April to June 2023

    Past India GDP growth rate figures

    Q1 20236.1%
    Q4 20224.5%
    Q3 20226.2%
    Q2 202213.1%

    Industry-wise breakdown

    Agriculture, Forestry & Fishing3.5%
    Mining & Quarrying5.8%
    Manufacturing4.7%
    Electricity, Gas, Water Supply & Other Utility Services2.9%
    Construction7.9%
    Trade, Hotels, Transport, Communication & Services related to Broadcasting9.2%
    Financial, Real Estate & Professional Services12.2%
    Public Administration, Defence & Other Services7.9%

    Figures for top economies of the world

    United States of America2.5%
    China6.3%
    Japan2.1%
    Germany-0.1%
    United Kingdom0.4%